blog posts and news stories

Empirical Describes Innovative Approach to Research Design for Experiment on the Value of Instructional Technology Coaching

Empirical Education (Empirical) is collaborating with Digital Promise to evaluate the impact of the Dynamic Learning Project (DLP) on student achievement. The DLP provides school-based instructional technology coaches to participating districts to increase educational equity and impactful use of technology. Empirical is working with data from prior school years, allowing us to continue this work during this extraordinary time of school closures. We are conducting quasi-experiments in three school districts across the U.S. designed to provide evidence that will be useful to DLP stakeholders, including schools and districts considering using the DLP coaching model. Today, Empirical has released its design memo outlining its innovative approach to combining teacher-level and student-level outcomes through experimental and correlational methods.

Digital Promise— through funding and partnership with Google—launched the DLP in 2017 with more than 1,000 teachers in 50 schools across 18 districts in five states. The DLP expanded in the second year of implementation (2018-2019) with more than 100 schools reached across 23 districts in seven states. Digital Promise’s surveys of participating teachers have documented teachers’ belief in the DLP’s ability to improve instruction and increase impactful technology use (see Digital Promise’s extensive postings on the DLP). Our rapid cycle evaluations will work with data from the same cohorts, while adding district administrative data and data on technology use.

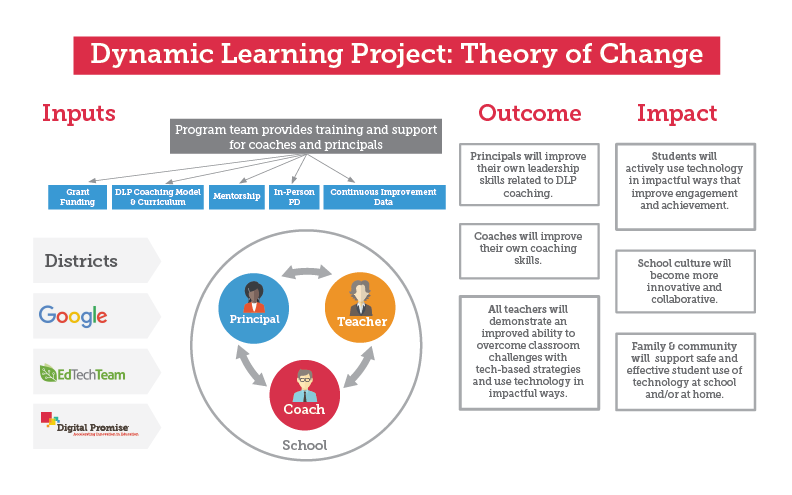
Empirical’s studies will establish valuable links between instructional coaching, technology use, and student achievement, all while helping to improve future iterations of the DLP coaching model. As described in our design memo, the study is guided by Digital Promise’s logic model. In this model, coaching is expected to affect an intermediate outcome, measured in Empirical’s research in terms of patterns of usage of edtech applications, as they implicate instructional practices. These patterns and practices are then expected to impact measurable student outcomes. The Empirical team will evaluate the impact of coaching on both the mediator (patterns and practices) and the student test outcomes. We will examine student-level outcomes by subgroup. The data are currently in the collection process. To view the final report, visit our Digital Promise page.

2020-05-01

Updated Research on the Impact of Alabama’s Math, Science, and Technology Initiative (AMSTI) on Student Achievement

We are excited to release the findings of a new round of work conducted to continue our investigation of AMSTI. Alabama’s specialized training program for math and science teachers began over 20 years ago and now reaches over 900 schools across the state. As the program is constantly evolving to meet the demands of new standards and new assessment systems, the AMSTI team and the Alabama State Department of Education continue to support research to evaluate the program’s impact. Our new report builds on the work undertaken last year to answer three new research questions.

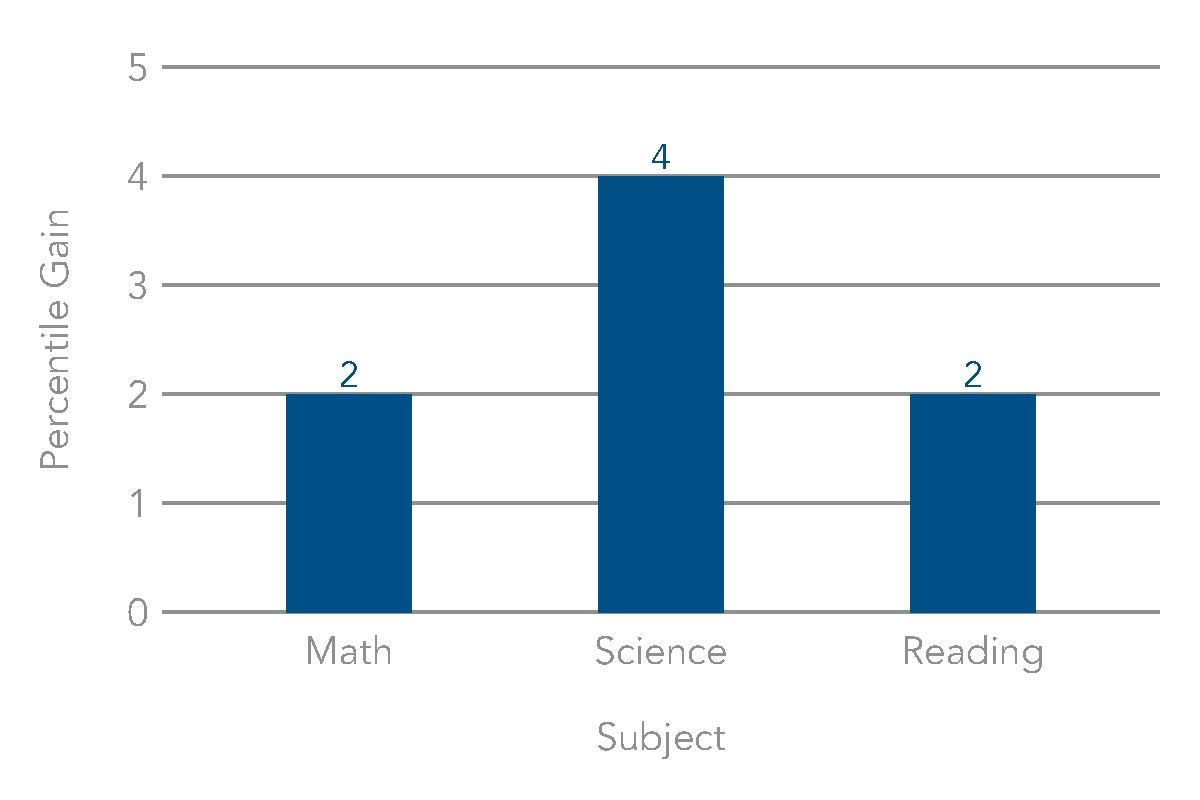
  1. What is the impact of AMSTI on reading achievement? We found a positive impact of AMSTI for students on the ACT Aspire reading assessment equivalent to 2 percentile points. This replicates a finding from our earlier 2012 study. This analysis used students of AMSTI-trained science teachers, as the training purposely integrates reading and writing practices into the science modules.
  2. What is the impact of AMSTI on early-career teachers? We found positive impacts of AMSTI for partially-trained math teachers and fully-trained science teachers. The sample of teachers for this analysis was those in their first three years of teaching, with varying levels of AMSTI training.
  3. How can AMSTI continue program development to better serve ELL students? Our earlier work found a negative impact of AMSTI training for ELL students in science. Building upon these results, we were able to identify a small subset of “model ELL AMSTI schools” where there was both a positive impact of AMSTI on ELL students, and where that impact was larger than any school-level effect on ELL students versus the entire sample. By looking at the site-specific best practices of these schools for supporting ELL students in science and across the board, the AMSTI team can start to incorporate these strategies into the program at large.

All research Empirical Education has conducted on AMSTI can be found on our AMSTI webpage.

2020-04-06

Report Released on the Effectiveness of SRI/CAST's Enhanced Units

Summary of Findings

Empirical Education has released the results of a semester-long randomized experiment on the effectiveness of SRI/CAST’s Enhanced Units (EU). This study was conducted in cooperation with one district in California, and with two districts in Virginia, and was funded through a competitive Investing in Innovation (i3) grant from the U.S. Department of Education. EU combines research-based content enhancement routines, collaboration strategies and technology components for secondary history and biology classes. The goal of the grant is to improve student content learning and higher order reasoning, especially for students with disabilities. EU was developed during a two-year design-based implementation process with teachers and administrators co-designing the units with developers.

The evaluation employed a group randomized control trial in which classes were randomly assigned within teachers to receive the EU curriculum, or continue with business-as-usual. All teachers were trained in Enhanced Units. Overall, the study involved three districts, five schools, 13 teachers, 14 randomized blocks, and 30 classes (15 in each condition, with 18 in biology and 12 in U.S. History). This was an intent-to-treat design, with impact estimates generated by comparing average student outcomes for classes randomly assigned to the EU group with average student outcomes for classes assigned to control group status, regardless of the level of participation in or teacher implementation of EU instructional approaches after random assignment.

Overall, we found a positive impact of EU on student learning in history, but not on biology or across the two domains combined. Within biology, we found that students experienced greater impact on the Evolution unit than the Ecology unit. These findings supports a theory developed by the program developers that EU works especially well with content that progresses in a sequential and linear way. We also found a positive differential effect favoring students with disabilities, which is an encouraging result given the goal of the grant.

Final Report of CAST Enhanced Units Findings

The full report for this study can be downloaded using the link below.

Enhanced Units final report

Dissemination of Findings

2023 Dissemination

In April 2023, The U.S. Department of Education’s Office of Innovation and Early Learning Programs (IELP) within the Office of Elementary and Secondary Education (OESE) compiled cross-project summaries of completed Investing in Innovation (i3) and Education Innovation and Research (EIR) projects. Our CAST Enhanced Units study is included in one of the cross-project summaries. Read the 16-page summary using the link below.

Findings from Projects with a Focus on Serving Students with Disabilities

2020 Dissemination

Hannah D’ Apice presented these findings at the 2020 virtual conference for the Society for Research on Educational Effectiveness (SREE) in September 2020. Watch the recorded presentation using the link below.

Symposium Session 9A. Unpacking the Logic Model: A Discussion of Mediators and Antecedents of Educational Outcomes from the Investing in Innovation (i3) Program

2019-12-26

Come and See Us in 2020

For a 13th consecutive year, we will be presenting research topics of interest at the annual meeting of the American Educational Research Association (AERA). This year, the meeting will be held in our very own San Francisco. Some of our presentation topics include: Strategies for Teacher Retention, Impact Evaluation of a Science Teacher Professional Learning Intervention, and Combining Strategic Instruction Model Routines with Technology to Improve Academic Outcomes for Students with Disabilities. We’ll also be making our unprecedented appearance at AERA’s sister conference The National Council on Measurement in Education (NCME). Our topic will be about connecting issues of measurement to accuracy of impact estimates.

In addition to our numerous presentations at AERA and NCME, we will also be traveling to Washington DC in March to present at the annual conference of the Society for Research on Educational Effectiveness (SREE). We’re included in three presentations as part of a symposium on Social and Emotional Learning in Educational Settings & Academic Learning, and we have one presentation and a poster that report the results of a randomized trial conducted as part of an i3 validation grant, and address certain methodological challenges we have faced in conducting RCTs generally. In all, we will be disseminating results of, and discussing approaches to addressing technical challenges, from three i3 projects. We have either presented at or attended the SREE conference for the past 14 years, and look forward to the rich program that SREE is bound to put together for us in 2020.

We would be delighted to see you in either San Francisco or Washington DC. Please let us know if you plan to attend either conference.

2019-12-16

Findings from our Recent Research on Learning A-Z’s Raz-Plus

Learning A-Z contracted with Empirical Education to conduct a study on their personalized reading solution: Raz-Plus. In 2019, Raz-Plus was honored by SIIA with a CODiE Award in the category of Best Reading/Writing/Literature Instructional Solution for Grades PreK-8!

We are excited to release the results of our recent study of Raz-Plus in Milwaukee Public Schools. Raz-Plus is a literacy program that includes leveled books, skills practice, and digital activities and assessments.

The quasi-experimental study was conducted using data from the 2016-17 school year and examined the impact of Raz-Plus usage on student achievement for 3rd, 4th, and 5th grade students using the STAR Reading (STAR) assessment. Nearly 25,000 students across 120 schools in the district completed over 3 million Raz-Plus activities during the study year. There were three main findings from the study:

  1. STAR scores for students in classes of teachers who actively used Raz-Plus are better than for comparison students. The result had an effect size of .083 (p < .01), which corresponds to a 3-percentile point gain on the STAR test, adjusting for differences in student demographics and pretest between Raz-Plus and comparison students.
  2. The positive impact of Raz-Plus was replicated across many student subgroups, including Asian, African-American, and Hispanic students, as well as economically disadvantaged students and English Language Learners.
  3. Several Raz-Plus usage metrics were positively associated with STAR outcomes, most notably the number of quizzes assigned (p < .01). The average student would expect to see a 1 percentile point gain in their STAR score for every 21 quizzes assigned.

This study added to a growing body of evidence, both in Milwaukee Public Schools and other districts around the country, demonstrates the effectiveness of Learning A-Z’s independent leveled curriculum products for literacy. You can download the report using the link below.

Read the summary and find a link to download the report here.

2019-12-05

The Power of Logic Models

The Texas Education Agency (TEA) has developed initiatives aimed at reducing the number of low-performing public schools in Texas. As part of Regional Educational Laboratory (REL) Southwest’s School Improvement Research Partnership (SWSI) with TEA and Texas districts, researchers from REL Southwest planned a series of logic model training sessions that support TEA’s school improvement programs, such as the System of Great Schools (SGS) Network initiative.

To ensure that programs are successful and on track, program developers often use logic models to deepen their understanding of the relationships among program components (that is, resources, activities, outputs, and outcomes) and how these interact over time. A logic model is a graphical depiction of the logical relationship among the resources, activities, and intended outcomes of a program, with a series of if-then statements connecting the components. The value of using a logic model to undergird programs is that it helps individuals and groups implementing an initiative to articulate the common goals of the effort. Additionally, it helps to ensure that the strategies, resources, and supports provided to key stakeholders are aligned with the articulated goals and outcomes, providing a roadmap that creates clear connections across these program components. Finally, over the course of implementation, logic models can facilitate decisionmaking about how to adjust implementation and make changes to the program that can be tested to ensure they align with overall goals and outcomes identified in the logic model.

The logic model training is designed to provide TEA with a hands-on experience to develop logic models for the state’s school improvement strategy. Another overarching goal is to build TEA’s capacity to support local stakeholders with the development of logic models for their school improvement initiatives aligned with Texas’s strategy and local context.

The first training session, titled “School Improvement Research Partnership: Using Logic Modeling for Statewide School Improvement Efforts,” was held earlier this year. SWSI partners focused on developing a logic model for the SGS initiative. It was an in-person gathering aimed at teaching participants how to create logic models by addressing the following:

  • Increasing knowledge of general concepts, purposes, and uses of logic models
  • Increasing knowledge and understanding of the components that make up a logic model
  • Building capacity in understanding links between components of school improvement initiatives
  • Providing hands-on opportunities to develop logic models for local school improvement initiatives

The timing of the logic model workshop was helpful because it allowed the district-focused SGS leaders at TEA to organize the developed SGS framework into a logic model that enables TEA to plan and guide implementation, lay the foundation for the development of an implementation rubric, and serve as a resource to continuously improve the strategy. TEA also plans to use the logic model to communicate with districts and other stakeholders about the sequence of the program and intended outcomes.

REL Southwest will continue to provide TEA with training and technical support and will engage local stakeholders as the logic models are finalized. These sessions will focus on refining the logic models and ensure that TEA staff will be equipped with the ability to develop logic models on their own for current and future initiatives and programs.

This blog post was co-published with REL Southwest.

2019-08-07

Conference Season 2019

Are you staying warm this winter? Can’t wait for the spring? Us either, with spring conference season right around the corner! Find our Empirical team traveling bicoastally in these upcoming months.

We’re starting the season right in our backyard at the Bay Area Learning Analytics (BayLAN) Conference at Stanford University on March 2, 2019! CEO Denis Newman will be presenting on a panel on the importance of efficacy with Jeremy Roschelle of Digital Promise. Senior Research Scientist Valeriy Lazarev will also be attending the conference.

The next day, the team will be off to SXSW EDU in Austin, Texas! Our goal is to talk to people about the new venture, Evidentally.

Then we’re headed to Washington D.C. to attend the annual Society for Research on Educational Effectiveness (SREE) Conference! Andrew Jaciw will be presenting “A Study of the Impact of the CREATE Residency Program on Teacher Socio-Emotional and Self-Regulatory Outcomes”. We will be presenting on Friday March 8, 2:30 PM - 4:00 PM during the “Social and Emotional Learning in Education Settings” sessions in Ballroom 1. Denis will also be attending and with Andrew, meeting with many research colleagues. If you can’t catch us in D.C., you can find Andrew back in the Bay Area at the sixth annual Carnegie Foundation Summit.

For the last leg of spring conferences, we’ll be back at the American Educational Research Association’s Annual (AERA) Meeting in Toronto, Canada from April 6th to 9th. There you’ll be able to hear more about the CREATE Teacher Residency Research Study presented by Andrew Jaciw, joined by Vice President of Research Operations Jenna Zacamy along with our new Research Manager, Audra Wingard. And for the first time in 10 years, you won’t be finding Denis at AERA… Instead he’ll be at the ASU GSV Summit in San Diego, California!

2019-02-12

Evidentally, a New Company Taking on Edtech Efficacy Analytics

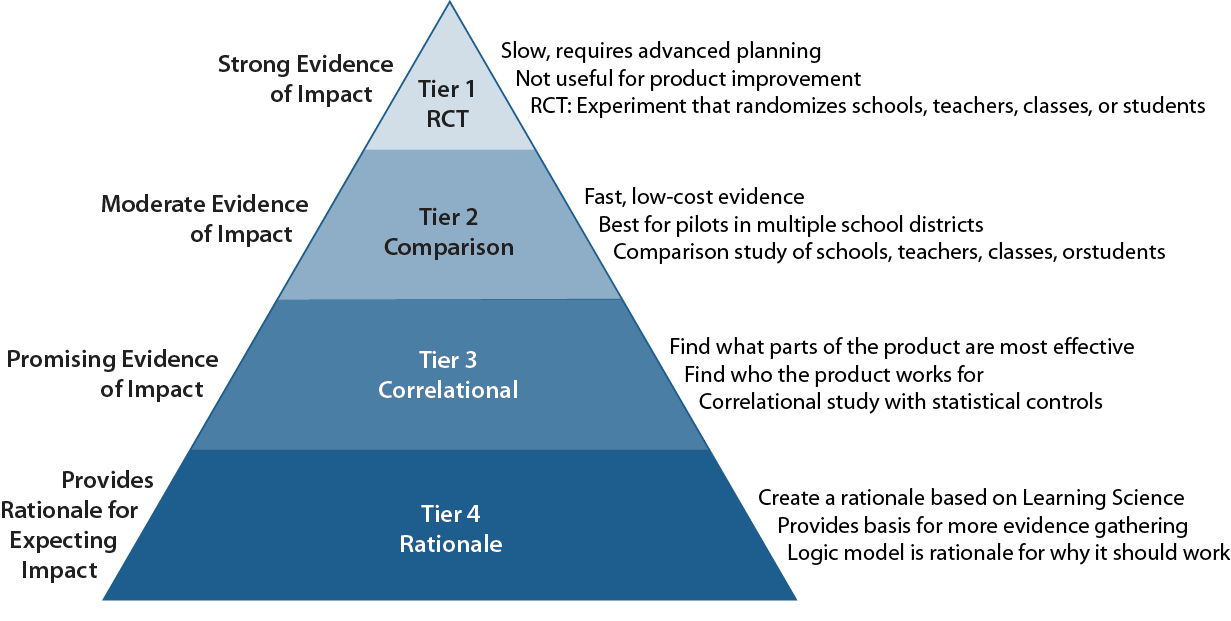
Empirical Education has launched Evidentally, Inc., a new company that specializes in helping edtech companies and their investors make more effective products. Founded by Denis Newman, CEO, and Val Lazarev, Chief Product Architect, the company conducts rapid cycle evaluations that meet the federal Every Student Succeeds Act standards for moderate and promising evidence. The efficacy analytics leverage the edtech product’s usage metrics to efficiently identify states and districts with sufficient usage to make impact studies feasible. Evidentally is actively servicing and securing initial clients, and is seeking seed funding to prepare for expansion. In the meantime, the company is being incubated by Empirical Education, which has transferred intellectual property relating to its R&D prototypes of the service and is providing staffing through a services agreement. The Evidentally team will be meeting with partners and investors at SXSW EDU, EdSurge Immersion, ASU GSV Summit, and ISTE. Let’s talk!

2019-02-06

Research on AMSTI Presented to the Alabama State Board of Education

On January 13, Dr. Eric Mackey, Alabama’s new State Superintendent of Education, presented our rapid cycle evaluation of Alabama Math, Science, and Technology Initiative (AMSTI). The study is based on results for the 2016-17 school year, for which outcome data were available at the time the Alabama State Department of Education (ALSDE) contracted with Empirical in July 2018.

AMSTI is ALSDE’s initiative to improve math and science teaching statewide; the program, which started over 20 years ago, now operates in over 900 schools across the state.

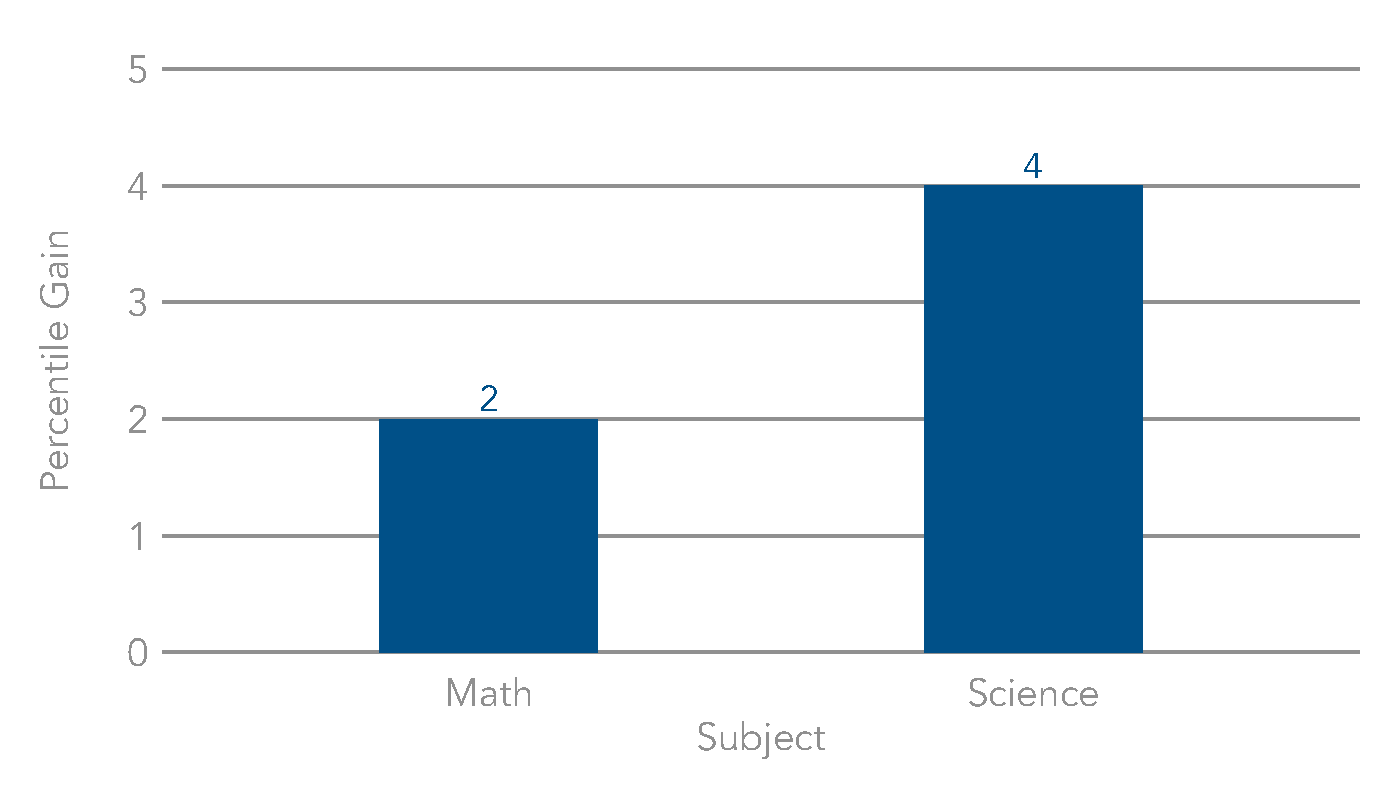
Our current project, led by Val Lazarev compares classes taught by teachers who were fully trained in AMSTI with matched classrooms taught by teachers with no AMSTI training. The overall results, shown in the above graph were similar in magnitude to Empirical’s 2012 study directed by Denis Newman and designed by Empirical’s Chief Scientist, Andrew Jaciw. That cluster-randomized trial, which involved 82 schools and ~700 teachers, showed AMSTI had a small overall positive effect. The earlier study also showed that AMSTI may be exacerbating the achievement gap between black and white students. Since ALSDE was also interested in information that could improve AMSTI, the current study examined a number of subgroup impacts. In this project we did not find a difference between the value of AMSTI for black and white students. We did find a strong benefit for females in science. And for English learners, there was a negative effect of being in a science class of an AMSTI-trained teacher. The state board expressed concern and a commitment to using the results to guide improvement of the program.

Download both of the reports here.

2019-01-22

View from the West Coast: Relevance is More Important than Methodological Purity

Bob Slavin published a blog post in which he argues that evaluation research can be damaged by using the cloud-based data routinely collected by today’s education technology (edtech). We see serious flaws with this argument and it is quite clear that he directly opposes the position we have taken in a number of papers and postings, and also discussed as part of the west coast conversations about education research policy. Namely, we’ve argued that using the usage data routinely collected by edtech can greatly improve the relevance and usefulness of evaluations.

Bob’s argument is that if you use data collected during the implementation of the program to identify students and teachers who used the product as intended, you introduce bias. The case he is concerned with is in a matched comparison study (or quasi-experiment) where the researcher has to find the right matching students or classes to the students using the edtech. The key point he makes is:

“students who used the computers [or edtech product being evaluated] were more motivated or skilled than other students in ways the pretests do not detect.”

That is, there is an unmeasured characteristic, let’s call it motivation, that both explains the student’s desire to use the product and explains why they did better on the outcome measure. Since the characteristic is not measured, you don’t know which students in the control classes have this motivation. If you select the matching students only on the basis of their having the same pretest level, demographics, and other measured characteristics but you don’t match on “motivation”, you have biased the result.

The first thing to note about this concern, is that there may not be a factor such motivation that explains both edtech usage and the favorable outcome. It is just that there is a theoretical possibility that such a variable is driving the result. The bias may or may not be there and to reject a method because there is an unverifiable possibility of bias is an extreme move.

Second, it is interesting that he uses an example that seems concrete but is not at all specific to the bias mechanism he’s worried about.

“Sometimes teachers use computer access as a reward for good work, or as an extension activity, in which case the bias is obvious.”

This isn’t a problem of an unmeasured variable at all. The problem is that the usage didn’t cause the improvement—rather, the improvement caused the usage. This would be a problem in a randomized “gold standard” experiment. The example makes it sound like the problem is “obvious” and concrete, when Bob’s concern is purely theoretical. This example is a good argument for having the kind of implementation analyses of the sort that ISTE is doing in their Edtech Advisor and Jefferson Education Exchange has embarked on.

What is most disturbing about Bob’s blog post is that he makes a statement that is not supported by the ESSA definitions or U.S. Department of Education regulations or guidance. He claims that:

“In order to reach the second level (“moderate”) of ESSA or Evidence for ESSA, a matched study must do everything a randomized study does, including emphasizing ITT [Intent To Treat, i.e., using all students in the pre-identified schools or classes where administrators intended to use the product] estimates, with the exception of randomizing at the start.”

It is true that Bob’s own site Evidence for ESSA, will not accept any study that does not follow the ITT protocol but ESSA, itself, does not require that constraint.

Essentially, Bob is throwing away relevance to school decision-makers in order to maintain an unnecessary purity of research design. School decision-makers care whether the product is likely to work with their school’s population and available resources. Can it solve their problem (e.g., reduce achievement gaps among demographic categories) if they can implement it adequately? Disallowing efficacy studies that consider compliance to a pre-specified level of usage in selecting the “treatment group” is to throw out relevance in favor or methodological purity. Yes, there is a potential for bias, which is why ESSA considers matched-comparison efficacy studies to be “moderate” evidence. But school decisions aren’t made on the basis of which product has the largest average effect when all the non-users are included. A measure of subgroup differences, when the implementation is adequate, provides more useful information.

2018-12-27
Archive