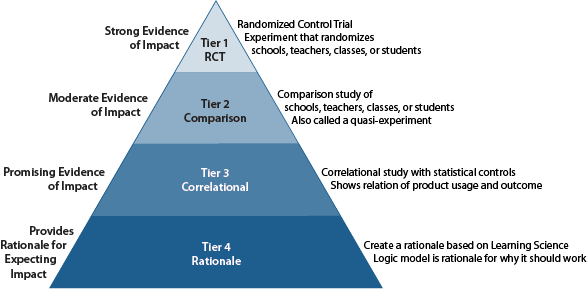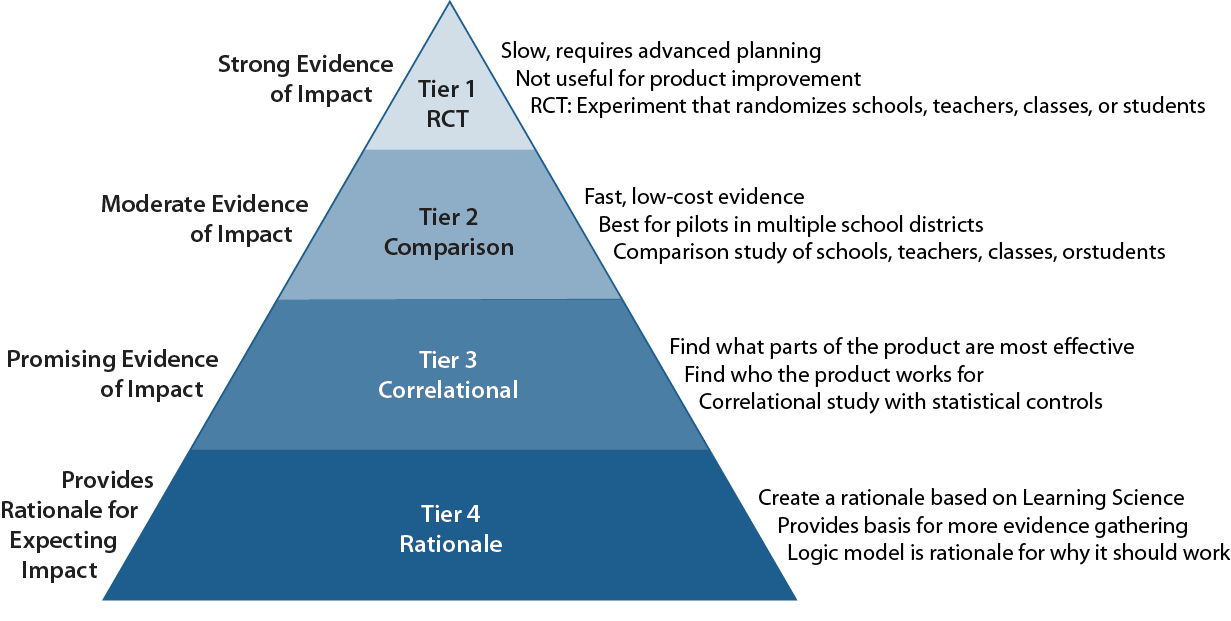
This is the third of a four-part blog posting about changes needed to the legacy of NCLB to make research more useful to school decision-makers. Here we show how issues of bias affecting the NCLB-era average impact estimates are not necessarily inherited by the differential subgroup estimates. (Read the first and the second parts of the story here.)
There’s a joke among researchers: “When a study is conducted in Brooklyn and in San Diego the average results should apply to Wichita.”
Following the NCLB-era rules, researchers usually put all their resources for a study into the primary result, providing a report on the average effectiveness of a product or tool across all populations. This leads to disregarding subgroup differences and misses the opportunity to discover that the program studied may work better or worse for certain populations. A particularly strong example is from our own work where this philosophy led to a misleading conclusion. While the program we studied was celebrated as working on average, it turned out not to help the Black kids. It widened an existing achievement gap. Our point is that differential impacts are not just extras, they should be the essential results of school research.
In many cases we find that a program works well for some students and not so much for others. In all cases the question is whether the program increases or decreases an existing gap. Researchers call this differential impact an interaction between the characteristics of the people in the study and the program, or they call it a moderated impact as in: the program effect is moderated by the characteristic. If the goal is to narrow an achievement gap, the difference between subgroups (for example: English language learners, kids in free lunch programs, or girls versus boys) in the impact provides the most useful information.
Examining differential impacts across subgroups also turns out to be less subject to the kinds of bias that have concerned NCLB-era researchers. In a recent paper, Andrew Jaciw showed that with matched comparison designs, estimation of the differential effect of a program on contrasting subgroups of individuals can be less susceptible to bias than the researcher’s estimate of the average effect. Moderator effects are less prone to certain forms of selection bias. In this work, he develops the idea that when evaluating differential effects using matched comparison studies that involve cross-site comparisons, standard selection bias is “differenced away” or negated. While a different form of bias may be introduced, he shows empirically that it is considerably smaller. This is a compelling and surprising result and speaks to the importance of making moderator effects a much greater part of impact evaluations. Jaciw finds that the differential effects for subgroups do not necessarily inherit the biases that are found in average effects, which were the core focus of the NCLB era.
Therefore, matched comparison studies, may be less biased than one might think for certain important quantities. On the other hand, RCTs, which are often believed to be without bias (thus, “gold standard”) may be biased in ways that are often overlooked. For instance, results from RCTs may be limited by selection based on who chooses to participate. The teachers and schools who agree to be part of the RCT might bias results in favor of those more willing to take risks and try new things. In that case, the results wouldn’t generalize to less adventurous teachers and schools.
A general advantage of RCEs (in the form of matched comparison experiments) have over RCTs is they can be conducted under more true-to-life circumstances. If using existing data, outcomes reflect results from field implementations as they happened in real life. Such RCEs can be performed more quickly and at a lower cost than RCTs. These can be used by school districts, which have paid for a pilot implementation of a product and want to know in June whether the program should be expanded in September. The key to this kind of quick turn-around, rapid-cycle evaluation is to use data from the just completed school year rather than following the NCLB-era habit of identifying schools that have never implemented the program and assigning teachers as users and non-users before implementation begins. Tools, such as the RCE Coach (now the Evidence to Insights Coach) and Evidentally’s Evidence Suite, are being developed to support district-driven as well as developer-driven matched comparisons.
Commercial publishers have also come under criticism for potential bias. The Hechinger Report recently published an article entitled: Ed tech companies promise results, but their claims are often based on shoddy research. Also from the Hechinger Report, Jill Barshay offered a critique entitled The dark side of education research: widespread bias. She cites a working paper that was recently published in a well-regarded journal by a Johns Hopkins team led by Betsy Wolf, who worked with reports of studies within the WWC database (all using either RCTs or matched comparisons). Wolf compared differences in results where some studies were paid for by the program developer and others paid for through independent sources (such as IES grants to research organizations). Wolf’s study found the size of the effect based on source of funding substantially favored developer sponsored studies. The most likely explanation was that developers are more prone to avoid publishing unfavorable results. This is called a “developer effect.” While we don’t doubt that Wolf found a real difference, the interpretation and importance of the bias can be questioned.
First while more selective reporting by developers may bias their reporting upward, other biases may lead to smaller effects for independently-funded research. Following NCLB-era rules, independently-funded researchers must convince school districts to use the new materials or programs to be studied. But many developer-driven studies are conducted where the materials or program being studied is already in use (or being considered for use and established as a good fit for adoption). The bias to the average overall effect size from a lack of inherent interest might result in a lower effect estimate.
When a developer is budgeting for an evaluation, working in a district that has already invested in the program and succeeded in its implementation is often the best way to provide the information that other districts need since it shows not just the outcomes but a case study of an implementation. Results from a district that has chosen a program for a pilot and succeeded in its implementation may not be an unfair bias. While the developer selected districts with successful pilots may score higher than districts recruited by an independently funded researcher, they are also more likely to have commonalities with districts interested in adopting the program. Recruiting schools with no experience with the program may bias the results to be lower than they should be.
Second, the fact that bias was found in the standard NCLB-era average between the user and non-user groups provides another reason to drop the primacy of the overall average and put our focus on the subgroup moderator analysis where there may be less bias. Average outcomes across all populations has little information value for school district decision-makers. Moderator effects are what they need if their goal is to reduce rather than enlarge an achievement gap.
We have no reason to assume that the information school decision-makers need has inherited the same biases that have been demonstrated in the use of developer-driven Tier 2 and 3 studies in evaluation of programs. We do see that the NCLB-era habit of ignoring subgroup differences reinforces the status quo and hides achievement gaps in K-12 schools.
In the next and final portion of this four-part blog series, we advocate replacing the NCLB-era single study with meta-analyses of many studies where the focus is on the moderators.


