The New York Times recently picked up a story, originally reported in Education Week two months ago, that school systems using formal methods for classroom observation as part of their educator evaluations are giving all but a very small percent of teachers high ratings—a phenomenon commonly known as the “widget effect.” The Times quotes Russ Whitehurst as suggesting that “It would be an unusual profession that at least 5 percent are not deemed ineffective.”
Responding to the story in her blog, Diane Ravitch calls it “unintentionally hilarious,” portraying the so-called reformers as upset that their own expensive evaluation methods are finding that most teachers are good at what they do. In closing, she asks, “Where did all those ineffective teachers go?”
We’re a research company working actively on teacher evaluation, so we’re interested in these kinds of questions. Should state-of-the-art observation protocols have found more teachers in the “needs improvement” category or at least 5% labeled “ineffective”? We present here an informal analysis meant to get an approximate answer, but based on data that was collected in a very rigorous manner. As one of the partners in the Gates Foundation’s Measures of Effective Teaching (MET) project, Empirical Education has access to a large dataset available for this examination, including videotaped lessons for almost 2,000 teachers coded according to a number of popular observational frameworks. Since the MET raters were trained intensively using methods approved by the protocol developers and had no acquaintance or supervisory relationship with the teachers in the videos, there is reason to think that the results show the kind of distribution intended by the developers of the observation methods. We can then compare the results in this controlled environment to the results referred to in the EdWeek and Times articles, which were based on reporting by state agencies.
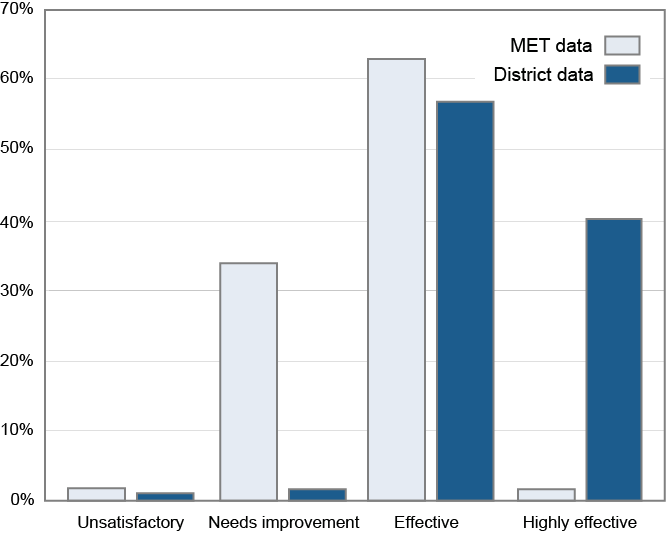
We used a simple (but reasonable) way of calculating the distribution of teachers in the MET data according to the categories in one popular protocol and compared it to the results reported by one of the states for a district known to have trained principals and other observers in the same protocol. We show the results here. The light bars show the distribution of the ratings in the MET data. We can see that a small percentage are rated “highly effective” and an equally small percentage “unsatisfactory.” So although the number doesn’t come up to the percent suggested by Russ Whitehurst, this well-developed method finds only 2% of a large sample of teachers to be in the bottom category. About 63% are considered “effective”, while a third are given a “needs improvement” rating. The dark bars are the ratings given by the school district using the same protocol. This shows a distribution typical of what EdWeek and the Times reported, where 97% are rated as “highly effective” or “effective.” It is interesting that the school district and MET research both found a very small percentage of unsatisfactory teachers.
Where we find a big difference is in the fact that the research program deemed only a small number of teachers to be exceptional while the school system used that category much more liberally. The other major difference is in the “needs improvement” category. When the observational protocol is used as designed, a solid number of teachers are viewed as doing OK but potentially doing much better. Both in research and in practice, the observational protocol divides most teachers between two categories. In the research setting, the distinction is between teachers who are effective and those who need improvement. In practice, users of the same protocol distinguish between effective and highly effective teachers. Both identify a small percent as unsatisfactory.
Our analysis suggests two problems with the use of the protocol in practice: first, the process does not provide feedback to teachers who are developing their skills, and, second, it does not distinguish between very good teachers and truly exceptional ones. We can imagine all sorts of practical pressures that, for the evaluators (principals, coaches and other administrators) decrease the value of identifying teachers who are less than fully effective and can benefit from developing specific skills. For example, unless all the evaluators in a district simultaneously agree to implement more stringent evaluations, then teachers in the schools where such evaluations are implemented will be disadvantaged. It will help to also have consistent training and calibration for the evaluators as well as accountability, which can be done with a fairly straightforward examination of the distribution of ratings.
Although this was a very informal analysis with a number of areas where we approximated results, we think we can conclude that Russ Whitehurst probably overstated the estimate of ineffective teachers but Diane Ravitch probably understated the estimate of teachers who could use some help and guidance in getting better at what they do.
Postscript. Because we are researchers and not committed to the validity of the observational methods, we need to state that we don’t know the extent to which the teachers labeled ineffective are generally less capable of raising student achievement. But researchers are notorious for ending all our reports with “more research is needed!”

